The Neighborhood Map of U.S. Obesity
Obesity is not evenly distributed across the United States. From sources such as the Behavioral Risk Factor Surveillance System (BRFSS) and the National Health and Nutrition Examination Survey (NHANES), data show that the proportion of the population that is obese various across states and counties. And although obesity is a national problem, many of the policies and interventions that would be most valuable in reducing obesity occur at the community or neighborhood level. Unfortunately, high-resolution maps of obesity at the community level do not exist. Without such maps, we don’t know where the most at-risk populations are, nor do we know where to target outreach, interventions, and community health activities to use resources most efficiently.
This information gap—high resolution, community level maps and geographic data on obesity—is what we have tried to fill. So we constructed a highly detailed map (and associated GIS database) of obesity across the United States. We call this the Neighborhood Map of U.S. Obesity. The U.S. Obesity Map was created entirely from public, government data sources.
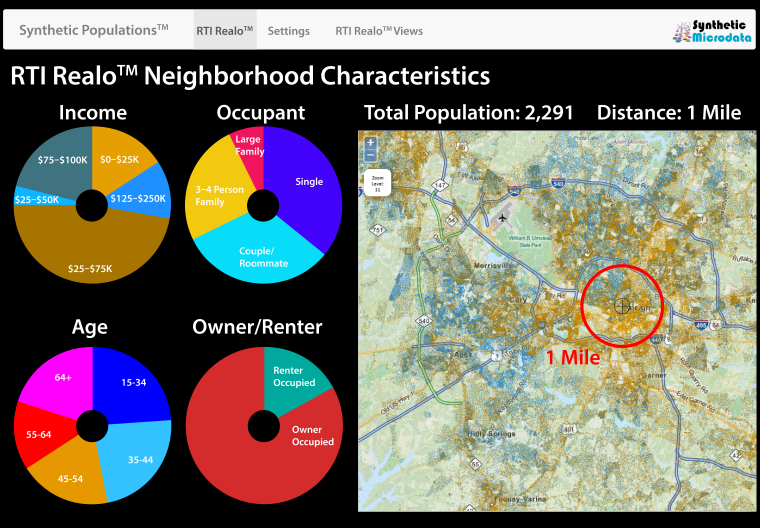
The first key source is the U.S. 2010 Synthetic Population Ver. 1, created by RTI. This dataset consists of a spatially and statistically accurate representation of each household and person in the U.S. with socio-demographic variables such as age, gender, income, race, educational attainment, household size, and ethnicity. The Synthetic Population data can be seen at synthpopviewer.rti.org. This synthetic population was created from 2010 Decennial Census data and 2007-2011 American Community Survey data. The spatial distribution of the synthetic population is based on the Integrated Climate and Land Use Scenario (ICLUS) data from the EPA.
The second key source dataset is the NHANES survey data. NHANES provides estimates of BMI by a number of socio-demographic co-variates such as age, gender, race, ethnicity, and educational attainment.
We use the NHANES BMI data to calculate statistical models that estimate the mean BMI and shape of the BMI distribution across age, gender, race, Hispanic origin, and educational attainment—all of which are correlated with obesity. We then use those estimates to attach a BMI value to EVERY adult person twenty years of age or older in the U.S. based on their age, gender, race, Hispanic origin, and educational attainment.
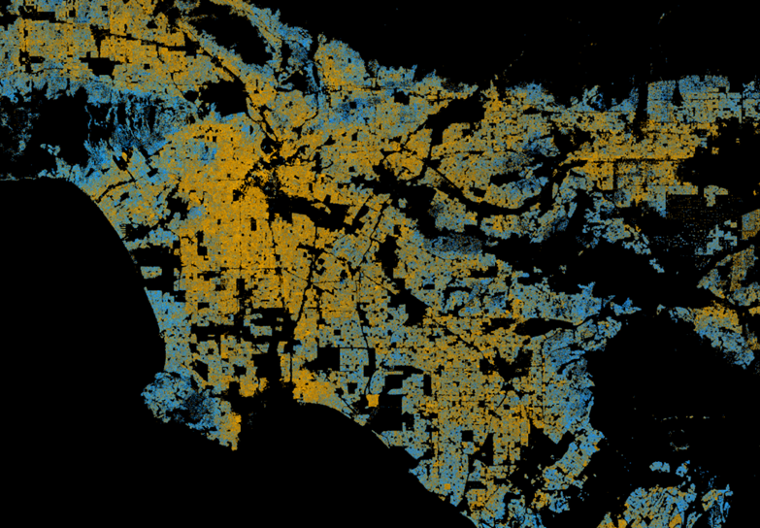
We then summarize BMI for people residing within polygon grid cells that are 250meters on a side—calculating, for example, the proportion of adults for each grid cell that have a BMI greater than 30.0. The results of this analysis is used to generate the color-coded maps of obesity.
Finally, we use spatial clustering methods (the Getis-Ord-Gi* hotspot analysis technique) to identify places where obesity clusters occur. The clustering technique calculates the likelihood that the cluster is statistically significant—that is, it is not the result of random chance. The results of the cluster analyses are also available to help users identify ‘real’ clusters of obesity.
Because the underlying data in the Neighborhood Map of U.S. Obesity is in a GIS format, users can download and bring this layer into their own GIS websites and tools. After downloading the data communities can overlay their own data such as locations of food retailers, restaurants, parks, walking paths, farmers’ markets, and healthy food outlets on the obesity mapping data. These map-based mashups will supplement their place-based work so they can target the neighborhoods where obesity is most likely and, therefore, they can be most efficient with limited resources.
The research community will also find value in the Neighborhood Map of U.S. Obesity. They can improve their evaluation of the efficacy of obesity intervention programs by improving how they select and define comparison/control neighborhoods. They can choose areas that match both the demographics AND the extent of the obesity program they are evaluating. Thus, program evaluators can measure apples to apples.
The Neighborhood Map of U.S. Obesity--helping communities, public health officials, medical practitioners, and the public to reduce obesity.

Obesity Research
Synthetic Populations™

FPOP™